New Census Data on Illinois’ Household Income, Poverty, & Health Coverage
Data inform decisions about how to invest in our communities. Census data are particularly helpful, as they allow us to track and measure progress in the key areas of economic security, education, and health. The annual American Community Survey estimates provide detailed demographic data that help us understand how Illinois children and families are doing and where we can improve outcomes. This week, new data from the U.S. Census Bureau’s Current Population and American Community Surveys (ACS) reveal the benefits of federal and state relief and investments for children and families in 2021.This post provides a general overview of the state-level 2021 ACS data release, reviewing information about household income, poverty, and health coverage. This data release provides updated information to YWCA’s 2022 Illinois KIDS COUNT policy brief, which provides more comprehensive information on the state of child well-being in Illinois and policy solutions for an equitable recovery.Data Release HighlightsACS state-level data illustrate how Illinoisans fared in 2021. On average, Illinois children and families experienced better outcomes than the national averages in median income, poverty, and health insurance coverage. Based on the data released today, these key areas were greatly impacted by federal and state COVID relief last year. From 2019 to 2021, our state’s median income only decreased, our poverty rates increased by less than 1%, and our uninsured rates decreased by thousands.Median Household IncomeMedian household income data give insight into the amount and distribution of income among households in a specific geography. In Illinois, the median household income was $72,205. In 2019 before the pandemic, the median household income was $69,187. When we take inflation into account, the median income has decreased by over $1,000 from 2021 to 2019. This indicates a reduction in household incomes across our state, but some households have experienced more decreases than others.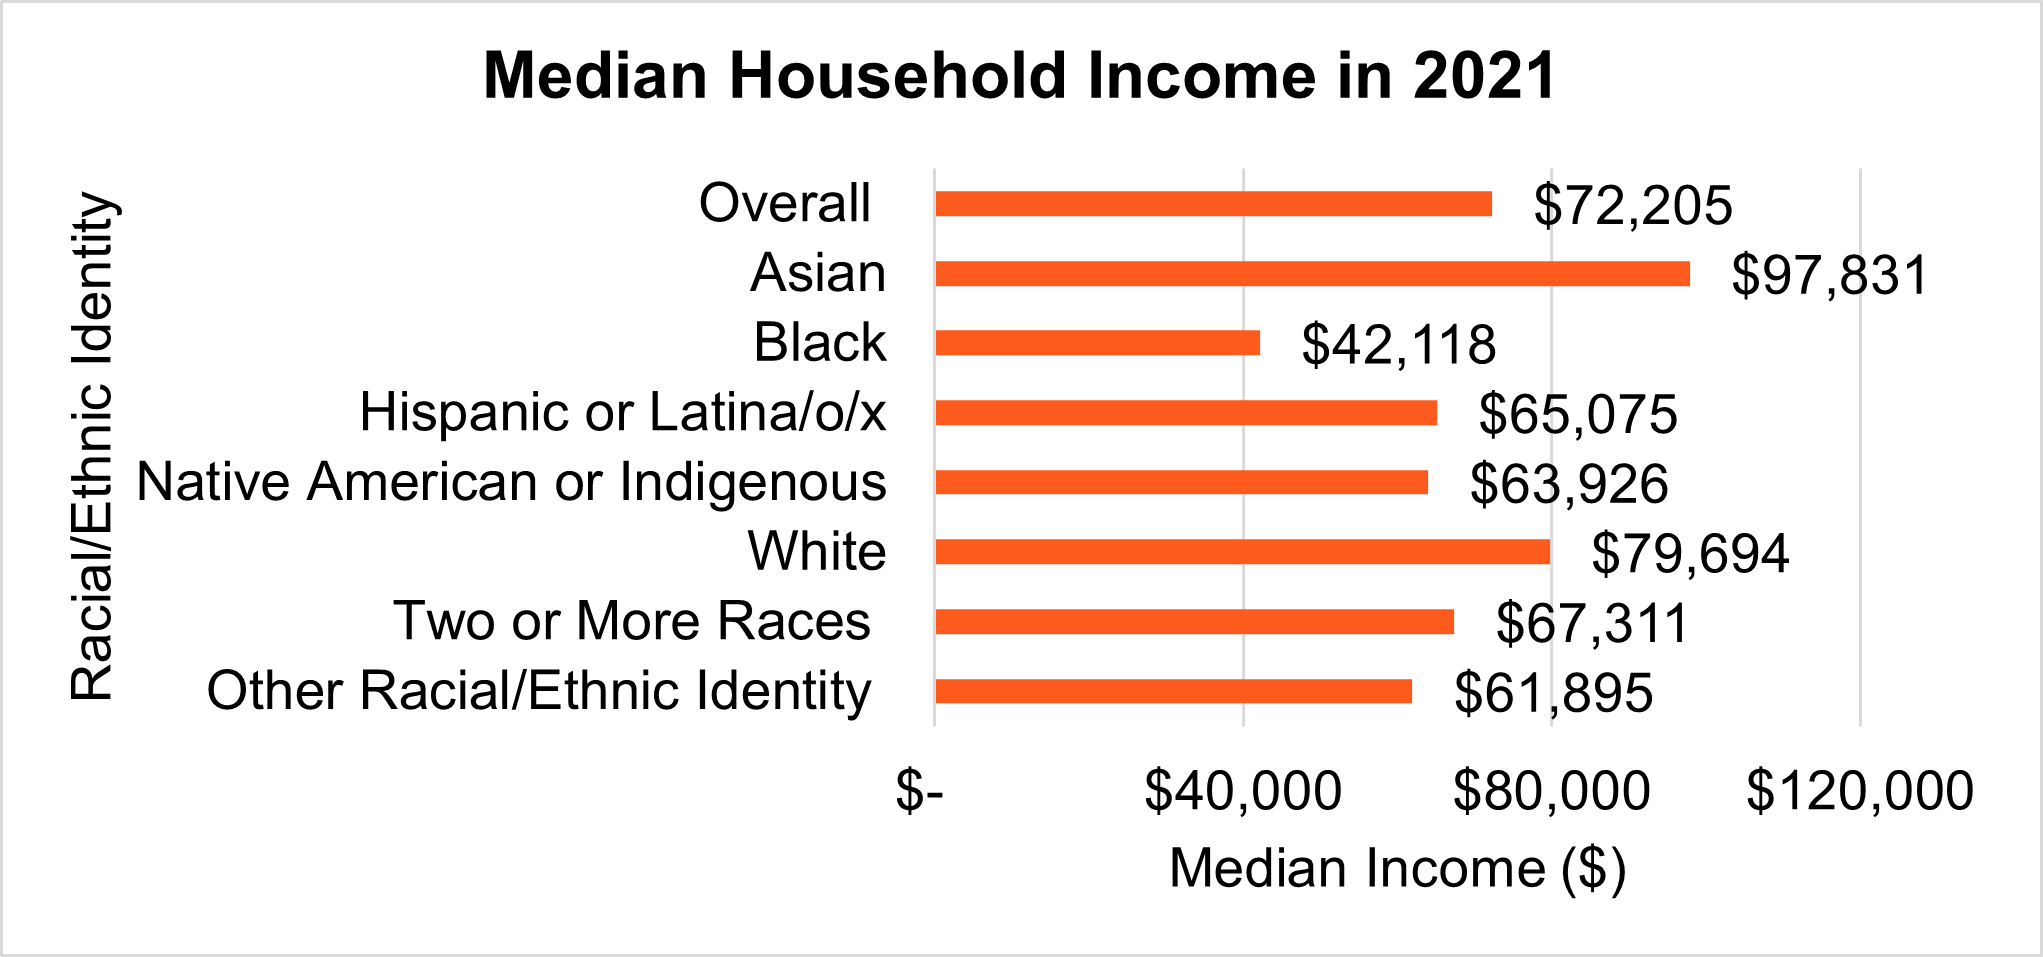 Households headed by women and households of color earn less over their lifetime. These disparities are due to systemic racism that results in inequities in accessing education and employment for women and people of color. The wage gap for women working full time, year-round has continued with men ($65,834) earning $13,711 more than women ($52,123). For households of color, the wage gap was even larger. Black households earned the least of all households, $42,118, which was $30,000 less than the Illinois median household income. These disparities make it clear that centering gender and racial equity in policies that boost household income can help alleviate inequities.PovertyThe poverty rate is determined by a household’s income. If a family or individual’s income is below the Federal poverty threshold, they are considered poor. For 2021, the official poverty threshold was $27,479 for a family of four. ACS data show that, relative to 2019, Illinois households experienced a 0.6% percent increase in poverty with almost 1.5 million (12.1%) of residents living in poverty. Disparities in racial/ethnic identity become apparent when we disaggregate the data. People of color experience higher poverty rates in Illinois. And Black Illinoisans face a poverty rate two times higher than residents of other racial/ethnic identities.
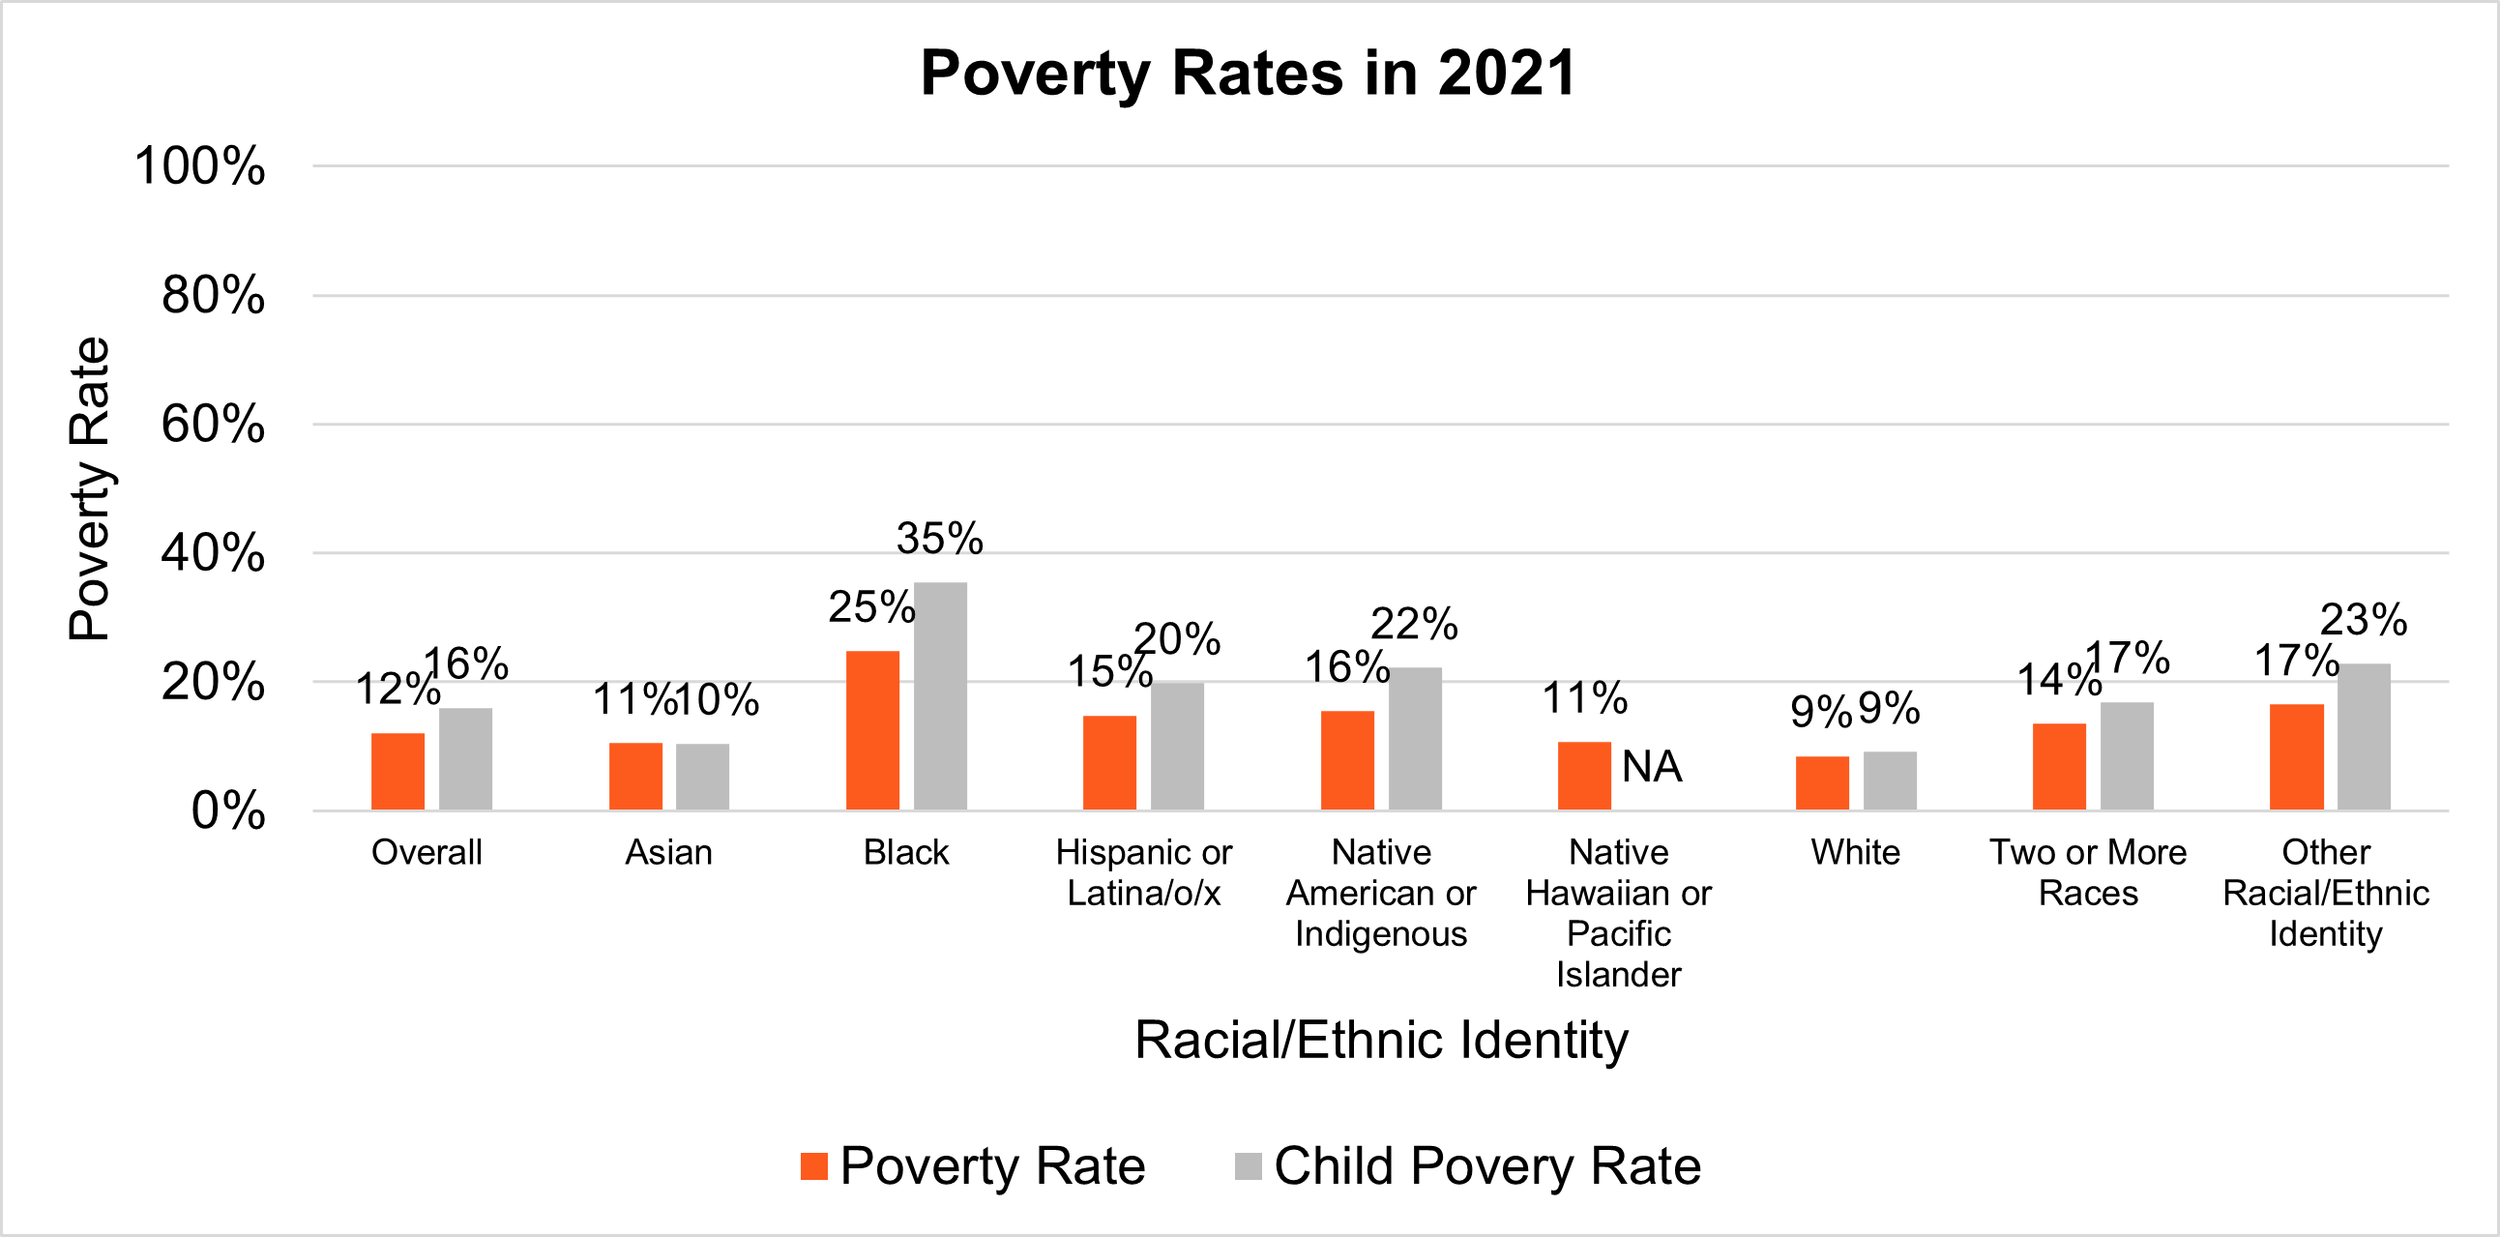 Compared to 2019, Illinois children experienced a 0.3% percent increase in poverty, with over 442,000 (16%) children living in poverty in 2021. When we disaggregate the data by racial/ethnic identity, it becomes clear that children of color are experiencing higher rates of poverty. Both Black and Latinx children in Illinois were more likely to experience poverty compared to other children. Growing up in poverty can have developmental consequences for children. Moreover, children can experience worse economic, health, and educational outcomes in the future. To address these challenges, anti-poverty solutions that increase financial security are critical to meeting basic needs and improving resources for children across the state.Health Coverage During a global pandemic, 875,000 (7.0%) Illinoisans were uninsured in 2021. This was 48,000 fewer Illinoisans uninsured than before the pandemic. The Illinois’ uninsured rate was lower than the national uninsured rate (8.6%). From 2013 to 2016, Illinois’ uninsured rates improved, but rates started reversing from 2017 to 2019. These increases in the number and percentage of uninsured among all Illinoisans and children was a concerning trend. Fortunately, these 2021 data demonstrate the pandemic-era health policies protected more Illinois residents from health emergencies and excessive health care costs. In terms of types of insurance, rates of Illinoisans with Employer-based and Medicare coverage stayed similar, while direct-purchase insurance (e.g., Affordable Care Act) and public insurance (e.g., Medicaid) increased from 2019 to 2021. Given the importance of health insurance coverage for both physical and mental health, Illinois must expand coverage to more adults--especially undocumented adults--and outreach to families regarding All Kids enrollment.
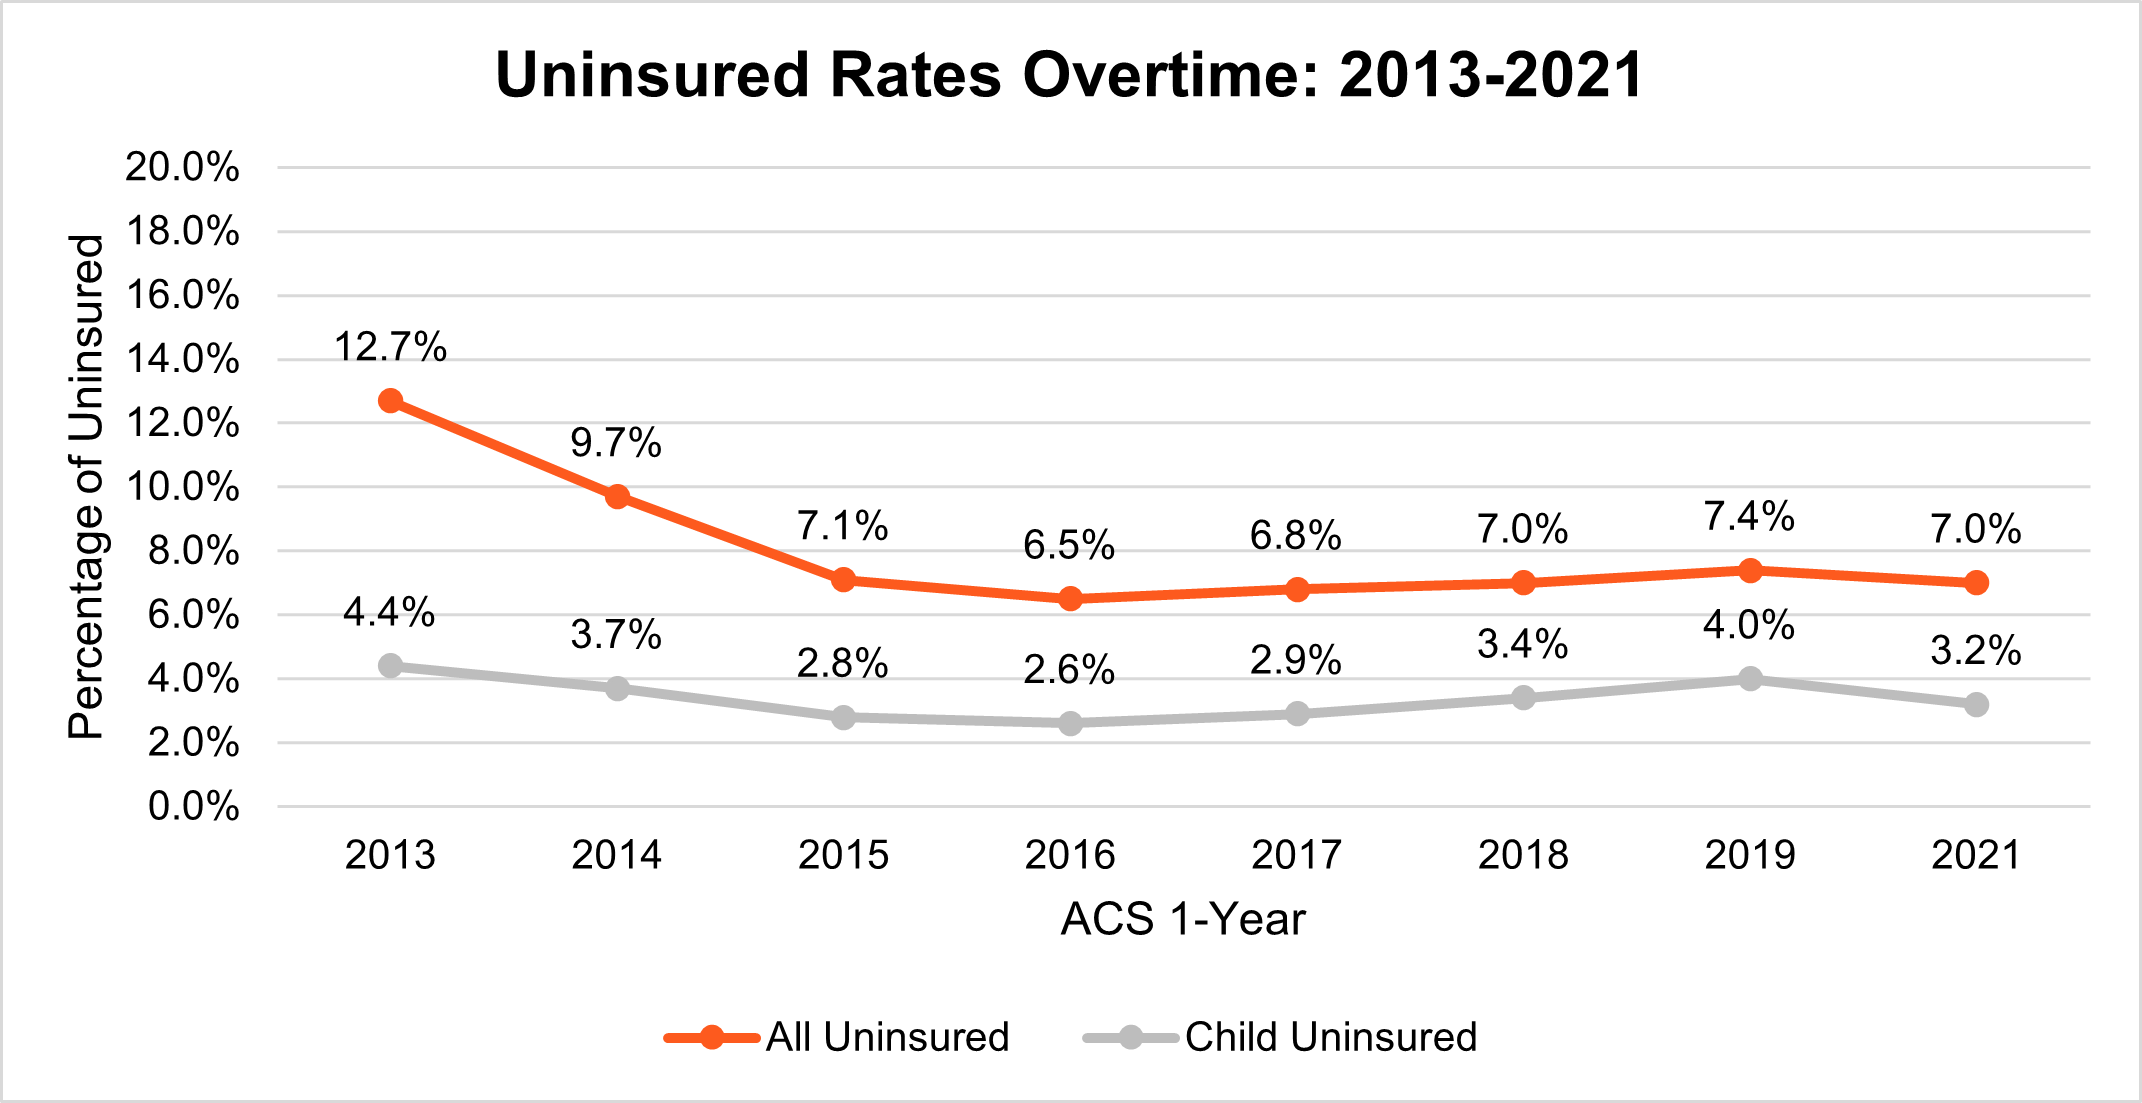 These data demonstrate the effectiveness of federal and state actions that protected many Illinois families from severe hardships. Unfortunately, any improvements in income, poverty, and health coverage will disappear in the coming years absent long-term state and federal investments in anti-poverty tools like the child tax credit; food and rental assistance; and more accessible health coverage. If you’re interested in learning more about Illinois-specific data, be sure to visit the KIDS COUNT Data Center. And check out our Data Center training series to help you become a data expert yourself.